Here’s the latest monthly economic report!
Last reports:
Here’s the latest monthly economic report!
Last reports:
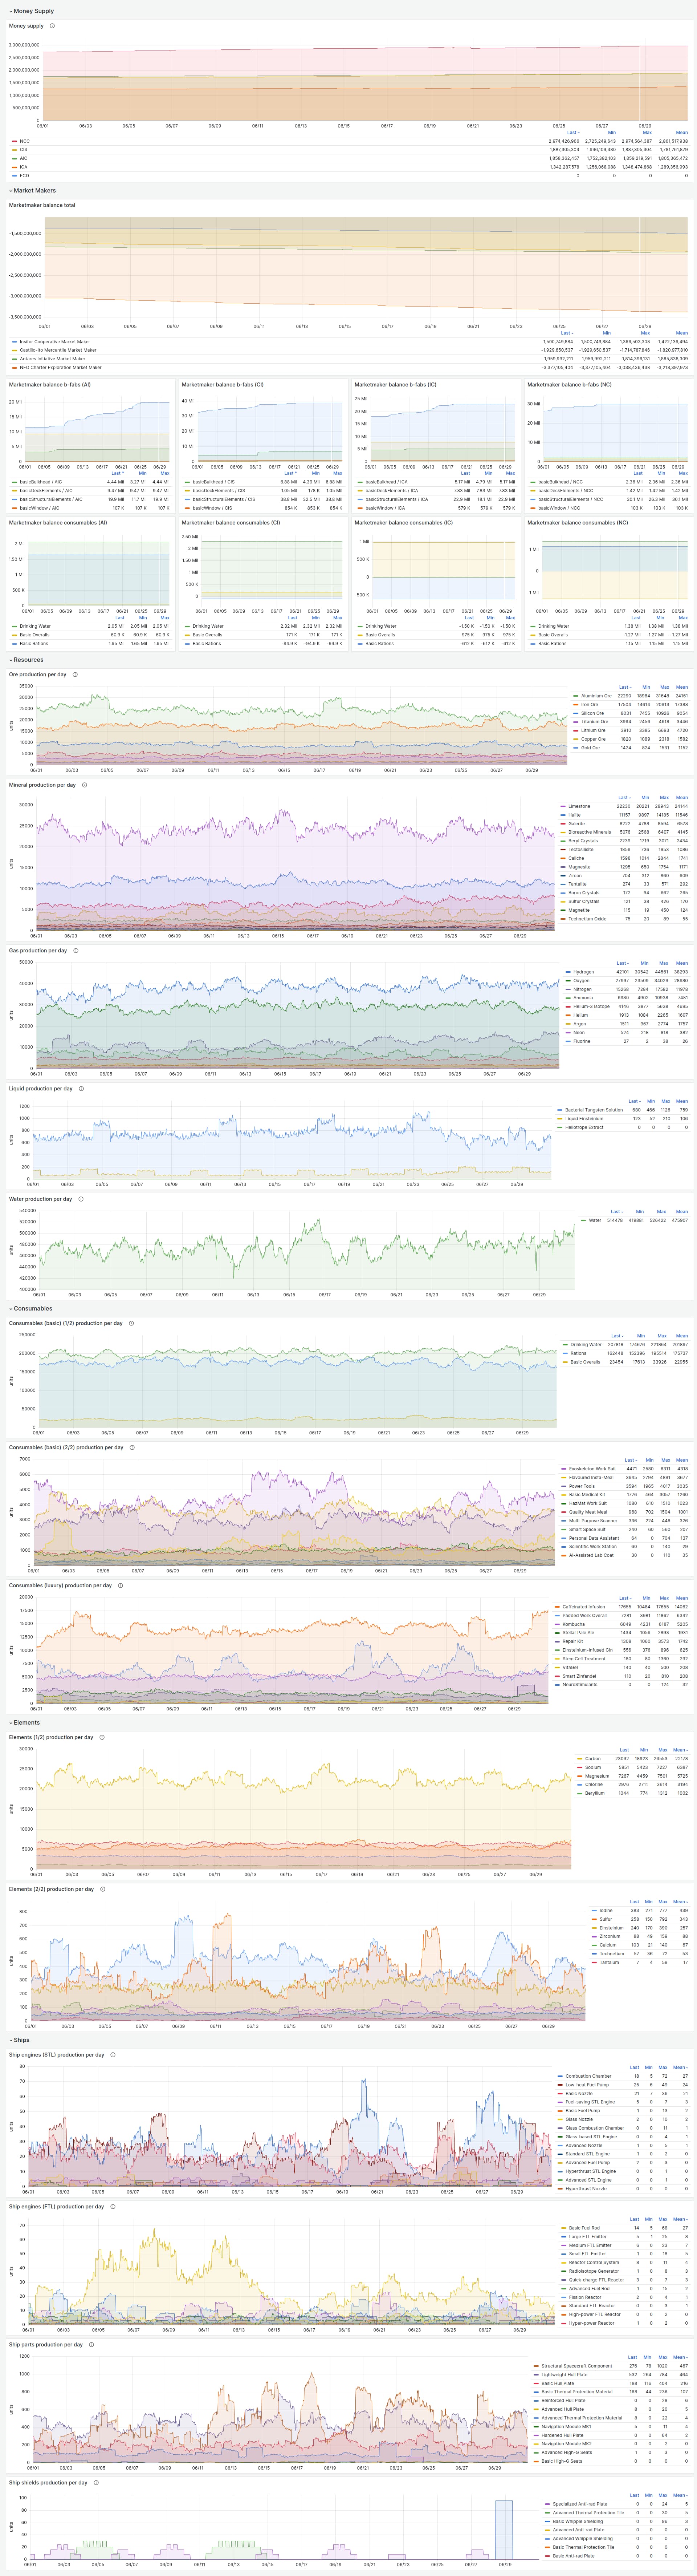
Great to see the supply on Bfabs are slowly catching up to demand ![]()
Thanks for adding the elements ![]() I really didn’t expect to see so much ES and so little TA!
I really didn’t expect to see so much ES and so little TA!
Alloys and Textiles would be the categories I’d most like to see next (I seem to be the only one expressing an opinion and hence getting it by default, so if anyone else has a preference please do take a turn!). But I think more importantly: would it be straightforward to add a “total” column that sums over the whole month? I suspect that for the lower-volume items (like all the ship parts) that a lot of production gets ‘lost’ in the daily rounding, and it would be nice to see a whole-month summary.
Thanks again for the update ![]()
Thanks for the new data! I’ve updated the sheet linked in the old post.
Because I have now three data points, I am officially allowed to fit lines. Using these privileges, I have therefore (roughly, by hand) determined that:
EDIT: Almost forgot: The total value for extracted resources stayed constant, but less money was created shifting us a bit more into deflation territory, no matter what you assume for the RE margins.
I was just reminded by another thread, that warehouse fees exist and are collected by the factions on CXes. Does that count into the overall money supply graphed here or is it not tracked at all?
If fees of any kind land at a faction they are considered a money sink and will go into that graph.
Cool, thanks for clarifying!