Well by definition, yes, smaller tick size = tighter spreads.
If you have a two markets, both are valued at $100. One has $1 ticks, one has $0.01 ticks.
As is quite common for low IV (implied volatility) stocks, spreads will collapse and people will be offering on both sides of the spread. As close as possible as things can be without matching.
In market one, you will have bids at $100 and asks at $101.
In the other market, you will have bids at $100.01 and asks at $100.02.
Technically, yes, the spread is “tighter” between the two in absolute terms. But there is a lot more that goes into the mechanism than just the spread.
Here’s the catch though. In volatile markets, where the spread might look something more like this:
Bids at $99 and asks at $101
Bids at $99.01 and asks at $101.01
Once volatility is high enough, like we see here in PRUN, the effective spread, regardless of tick size, increases. That’s why we have a bid at $55 and asks at $65. That spread will be maintained across both markets, all else being equal. However, any change in price dictated by someone wanting to offer a better price actually moves the price by $1 instead of $0.01. This means prices “react” and “correct” faster, increasing the speed at which prices match and someone is willing to accept someone else’s price offer instead of throwing up their own bid.
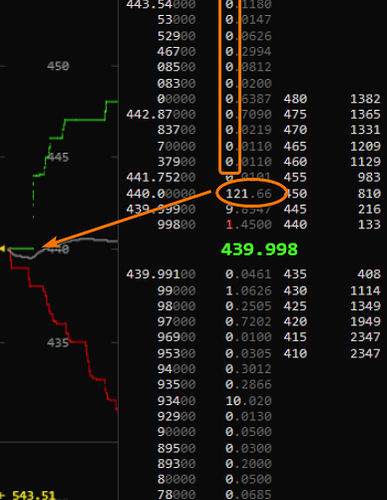
This also ties into implied liquidity or whatever it’s called. Here’s a great example:
The orderbook is as we are used to it here in PRUN. But the green and red lines are a graphed visualization of the orderbook.
The main point I’d like to make here is this concept - if you have no restrictions on tick size, and the volatility of the market is far lower than the spread that is maintained by the tick size, you will see events like this. Where all of the liquidity is focused up directly at the front of the orderbook, but there is nothing behind it. Notice how the orderbook behind this large cluster of orders is completely empty.
This is in contrast to what normal, healthy orderbooks look like:
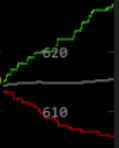
Regarding volatility: It will undoubtedly go up. That’s the whole point, I thought. To increase the speed in which prices change.
Now this is quite interesting. I don’t think we can count prices bouncing back and forth between the best bid and ask to be “volatility”. Volatility, in my mind, is a meaningful change in the offering and structural price difference in the market. If a market is just bouncing back and forth between bid at $55 and asks at $65, that is a lot different than a market with very tight spreads moving from $55, to $65.
We’re never going to have penny-tight spreads in PRUN. But I think we can make meaningful change in some of the more extreme examples by implementing measures that will improve the health of the market for everyone.
Now let us look at actual PRUN markets.
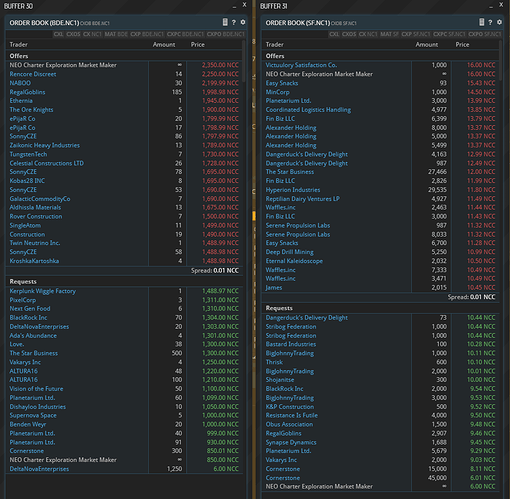
Here is Bfabs and SF. Both of these orderbook snapshots are typical for moria, and they are also very similar in the total # of orders they both have.
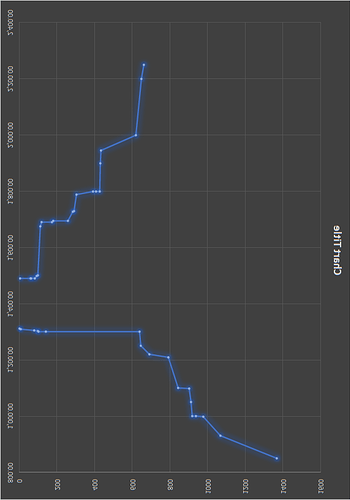
I then graphed the spreads and the orderbook structure of these two markets. I formatted the orderbook so that it looks the same as the previous picture. Asks ontop, bids on bottom.
The numbers on the axis are only a guide to show where you are - we’re looking at the dots and the slope of each orderbook as it’s graphed here.
Please excuse the 90 degree rotation, I didn’t want to slam my face into Excel to figure out how to rotate the axis points of my data.
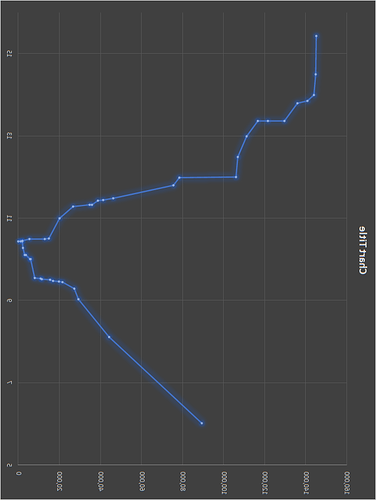
Now let’s take a look at the SF market.
A few things I’d like to point out.
Notice how each of the dots represent an order? Notice how there are fewer “clusters” of dots at exactly the same price? They are far more spread out across a range of prices.
And note how so many of the orders are clustered much much closer to the spread, which in itself is far smaller?
And notice how these is a far more even distribution of orders in the SF market, with a far more linear slope across a range of prices with less “Stair stepping” as we see in the BFAB market?
This is a sign of a much healthier market.
Why is the SF market much healthier? Because it has a far larger effective tick size resulting in meaningful price differences anytime anyone wants to be closer to the front of the orderbook. This, over time, tightens the spread in this real-world example, and offers a more even distribution of supply & demand across a range of prices in a healthier manner.
