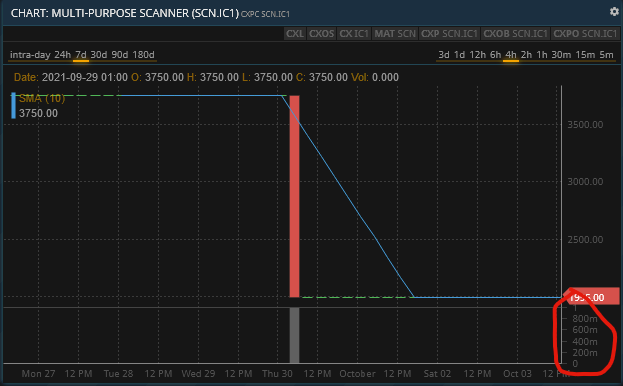
The volume graph in the market chart uses an odd scale. Some examples:
One unit of SCN was traded, but instead of showing 0, 0.2, 0.4, 0.6, 0.8, 1, the vertical axis shows 0, 200m, 400m, 600m, 800m, 1:
.
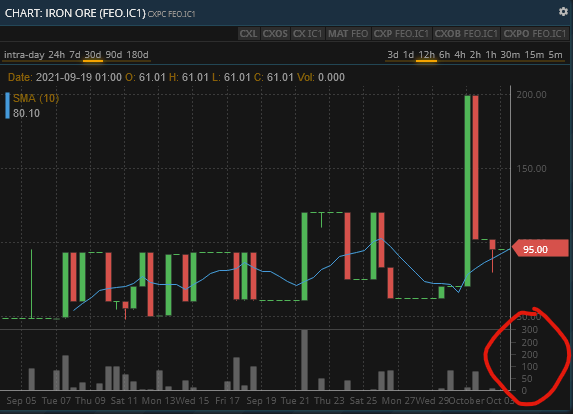
In the below chart, the largest trade for FEO was ~250 units, but instead of showing 0, 50, 100, 150, 200, 250, the vertical axis shows 0, 50, 100, 200, 200, 300. Note that the ticks are equally spaced, yet 200 is showing twice - once where 150 ought to be, and once where the real 200 is. Then 300 is showing where 250 ought to be.
.
My guess would be that instead of using a straightforward numeric output for the ticks, it’s using a function designed to display rough distances in km. Hence rounding up to the nearest 100, showing fractions as X hundred metres, etc.